5 Top Excel FP&A Skills for Financial Planning
It is simply astounding that FP&A and accounting experts are still using Excel. One obvious reason for that is because it is highly effective for almost everything accounting.
Problem arises when FP&A specialists have to use excel for much more than just number crunching. When they want to use it for analyzing data and extracting insights from it. Is excel effective for all that?
You may be surprised but yes excel is still one of the top mathematical software for analyzing and visualizing data. Although the interface of excel still remains oldschool, only a few have surpassed the features it offers to the accountants and FP&A specialists.
Reporting that would have taken hours to present manually can now be done in minutes using Excel spreadsheets for anything from financial forecasts and modeling to budget templates and month-end close.
If your FP&A teams need to update their Excel abilities, then this article is a great way to start. By using the tips we have described in this article, you can easily switch from manual data crunching in Excel to a fully automated excel setup.
List of 5 Top FP&A Excel Skills for Financial Experts
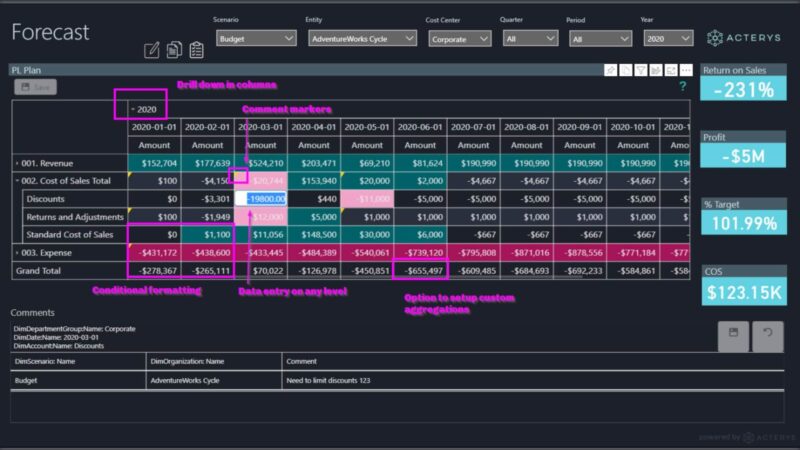
- Using Conditional Formatting
Conditional formatting is a comparatively new feature in Excel and Google Sheets. It is accessible from the home tab. You can easily format the cells in your spreadsheet by conditions with the help of this feature. .
For instance, at its most fundamental level, a formula may be used to designate the color red for cells within a certain range where the formula’s output is higher than 45, and the color green for cells where the formula’s output is less than 45.
Basically, all you have to do is:
If you go to the Conditional Formatting menu and choose New Rule, you may create a new rule.
Choose “Use a formula to decide which cells to format” and then click “OK.”
Then, insert the condition’s formula in the “Format values when this formula is true:” box, and WHAM!
The beauty of conditional formatting is best shown by what happens when you modify the values in any green cells to equal 46. The color of the cell will automatically change to reflect the change in value.
How FP&A Experts Can Use Conditional Formatting in Excel?
The use of conditional formatting aids accountants and financial experts in spotting potential problems. To help, let’s return to our original example of red and green cells. Overdue debts might be located in cells where the value is more than 45. A quick check at the red-highlighted cells will tell you which bills are overdue. Also, any green cells indicate payment terms of 45 days or less from the invoice date. If you use conditional formatting, you may get a short glance at your books and general ledger or a thorough deep dive into the numbers.
With conditional formatting, the user may be as creative as they want when deciding how to apply the formatting. If you need to do an in-depth analysis of your sales figures, you may quickly and easily do so.
- Using Macros in Excel
Now that we’ve met Excel’s “coolest” function, let’s move on to its “most powerful” counterpart. You can program nearly anything into an Excel macro using Visual Basic for Applications (VBA). To get started with programming, a crash course in VBA is all you need. We believe that VBA is an indispensable tool for accountants and other financial professionals. It even works for sales and marketing departments if you are willing to put in the energy to learn VBAs.
But don’t worry, you don’t need to know how to code to record macros in excel. You can do basic tasks and even make buttons in excel using the Quick Access Toolbar (QAT).
Macro programming is a simple method for automating routine tasks. Just make a video of yourself following the instructions and save it. The annoying routines may be performed with a single press of a button thanks to your predefined macros.
How Macros Works for FP&A in Excel?
Experts in financial planning and analysis rely on macros to automate the modeling process. Prior to constructing macros in VBA for your model, you must establish its purpose. When you know what information you want to extract from the model, such as a sales estimate for the fourth quarter, it’s simple to set up the logic, enter the relevant data, determine the desired output, and last, execute the macro. Finally finished the model.
Modeling is used throughout the corporate finance spectrum, from mergers and acquisitions to capital budgeting. In addition, it assists with project financing by providing an estimate and projection of cash flow requirements.
- Using Pivot Tables to Analyze Data
Some of the most interesting and useful features of Excel have been introduced. Get ready to meet the holy grail of every CFO and financial manager: the pivot table.
There are several ways in which you may use this feature to analyze data. Use pivot tables to analyze sales revenue by geographic area, time period, or retail location.
There aren’t many steps involved in using pivot tables, but the payoff is huge.
Using the Insert tab, choose a dataset cell and click Pivot Table.
How Pivot Tables Work in Excel for FP&A?
Database management systems are a CFO’s dream since they take a dataset and show it as a table that can be updated or sorted depending on multiple factors. Pivot tables provide you numerous distinct perspectives in the same table.
Categories such as gender, region, who paid, and total expenses may be dragged from the pivot table menu to the rows and filter section. The sum of the costs in each category is represented by the number in the pivot table.
- Charts and Graphs in Excel
If you want to create a table with Excel, turn to the charts, which may not be the trendiest or most powerful or even the favorite feature of your CFO. When it comes to conveying information, nothing beats a well-made chart, and Excel offers a wide variety of options for creating such visuals.
For the decision-makers in your business, creating charts that convey the narrative of your data is as easy as doing two steps:
To access the Column, Line, Pie, Bar, Area, Scatter, and Other Charts, go to the Charts group on the Insert ribbon. There is a further level of refinement for each option. In Excel, you can use the Recommended Charts option to have the program make an educated estimate as to which chart type will work best with your data.
How to Use Charts and Graphs in Excel?
Financial planning and analysis specialists might use charts to visually convey their findings to stakeholders and decision-makers who aren’t experts in their field.
To illustrate, suppose you were a multinational clothes shop interested in January sales. Easy. If you create a bar chart, you can quickly see how much money you’re making in each nation.
- Data and What-If Tables
Sensitivity analysis, a crucial component of most business models, may be facilitated by data or what-if tables; mastery of these is the last ability required to become an Excel Ninja. The Data Table function may be accessed via the What-If Analysis menu on the Data tab’s ribbon.
How to Use What-If Tables in Excel?
Since what-if scenarios are important to business modeling, Excel is providing just what you need. You may now query your data for answers to queries like “what would happen to revenues if the unit cost increased by x percent” What if, instead, our rivals lowered their prices by x percent?
Answers to these sorts of inquiries may be found in data tables. What-if tables may be divided into two categories: one-way and two-way. Both one-way and two-way data tables include inputs and outputs, but the latter has only one output for each pair of inputs.
Bottom-line: Excel Tips for FP&A Professionals
Thanks to updates in Excel and Power BI, they are now considered effective FP&A tools. The nicest thing about automating mundane tasks is that you can keep utilizing the Excel valuation models and worksheets you already know and love.
For effective financial planning and analysis, finance departments may rely on Acterys.com. Additionally, Acterys helps you get beyond Excel’s restrictions by providing features like versioning, instantaneous changes, and complete data integrity.
Acterys also offers the means to automate and exploit Excel even if your data is growing out of control.
Learn more about Acterys financial planning tool and how it can help you integrate and forecast data with Power BI & Excel.
About Acterys FP&A Tool for Excel
Acterys Power BI Sync is a Windows application or cloud-based service that adds planning and write back capabilities to any Power BI model and automates the integration with your data warehouse. Synchronize any Power BI model in Desktop, Service and Dataflows with relational databases in the cloud or on-premise.