11 Benefits of Resource Planning in Power BI
One cannot stress the importance of resource planning for any company that aspires to grow. Learn how your employees, customers, and company can get the maximum rewards from better resource planning using business intelligence and data insights.
In this article, we will discuss why you should be using Power BI for resource planning of your business.
What is Resource Planning?
Resource Planning is the process of estimating and scheduling the use of resources to achieve desired objectives. It includes forecasting future needs, allocating resources, and monitoring actual usage against plans. Effective resource planning can help ensure that projects are completed on time and within budget.
Why Do Resource Planning for Business?
Resource planning is important for businesses because it allows them to optimize their resources in order to achieve their goals. By planning their resources, businesses can ensure that they are using their time, money, and other assets in the most effective way possible. This can help them to be more productive and efficient, which can lead to increased profits.
Why Use Power BI for Resource Planning?
Power BI provides an intuitive interface for creating resource plans. With its drag-and-drop functionality, you can quickly create and modify your plan as needed. Additionally, Power BI offers a variety of reporting features that allow you to track your progress and identify potential issues.
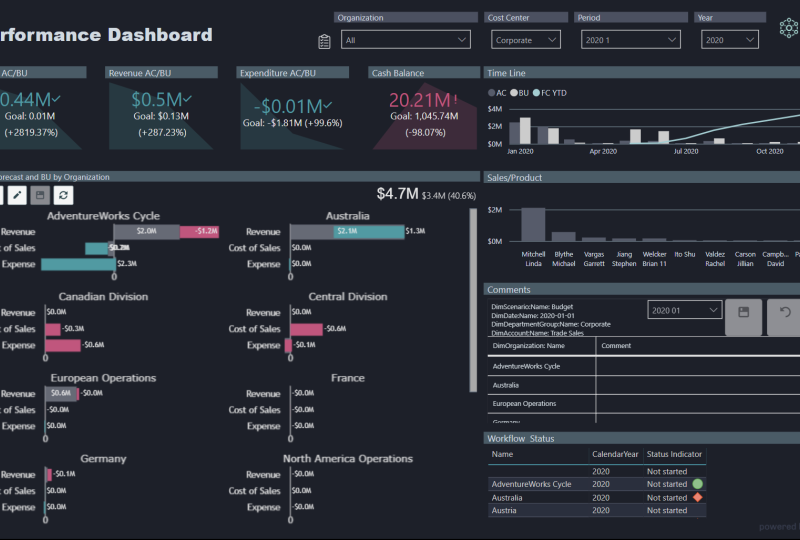
Power BI is a powerful business intelligence tool that can be used for resource planning. With Power BI, you can create dynamic dashboards and reports that show how your resources are being used. You can also use Power BI to track your progress towards your goals and identify areas where you need to make changes.
List of Benefits of Resource Planning in Power BI
We have prepared a list of why resource planning in Power BI can help businesses become more profitable.
- Enhanced Data Forecasting
Forecasting is a critical component of effective data analysis. In order to improve forecasting accuracy, it is important to use all available data. In many cases, this includes enhanced data that has been cleaned and processed to remove noise and other factors that can distort results. Power BI offers several tools that can be used to improve forecasting accuracy, including the Time Series Forecasting tool and the Custom Functions tool. The Time Series Forecasting tool can be used to predict future values based on historical data, while the Custom Functions tool can be used to perform custom calculations on data sets. These tools can be used together to produce accurate forecasts for your data.
- Better Business Insights
One of the best features of Power BI is the ability to get better insights for your resource planning data. You can use the built-in tools to create reports and dashboards that show you how your resource plans can be improved and optimized. You can also use the data analysis features to explore your data in more detail and find trends and patterns.
- Pre-planning of Resource Allocation
In any business, it is important to allocate resources in a way that maximizes their return on investment (ROI). Power BI can help with pre-planning for resource allocation by providing insights into how different scenarios may impact the bottom line. With its interactive visuals and powerful analytics, Power BI can help business leaders make data-driven decisions about where to allocate their resources. This can lead to increased efficiency and profitability for the business.
- Identify Bottlenecks
Power BI can help identify where resources are being bottlenecked in the planning process. This can help managers optimize their plans and allocate resources more efficiently. For example, if the analysis shows that there is a shortage of workers in a particular area, the manager can then shift workers from other areas to cover the shortfall.
- Progress Charts
Progress charts are a great way to visualize the progress of a task. In Microsoft Power BI, you can create a progress chart to show the percentage of completion for a task. You can also use a progress chart to show the amount of work that has been completed over time. This is great for all resource planning professionals looking to get more efficient in resource allocation.
- Enhanced Employee Satisfaction
Power BI is a great tool for enhancing employee satisfaction. By tracking employee satisfaction data, managers can see what makes their employees happy and dissatisfied, and make changes to improve the work environment. Additionally, Power BI can be used to create reports and dashboards that show how employee satisfaction impacts key performance indicators such as productivity and customer satisfaction. This information can help managers make better decisions about their workforce and improve overall organizational performance.
- Increased Profitability
Organizations are looking for ways to increase their profitability. One way to do this is by using Power BI. Power BI is a tool that allows businesses to analyze their data and see what areas need improvement. This can help businesses to make changes that will increase their profits.
- On-Time Product Delivery
Resource planning requires gantt charts for prediction and forecasting. Resource planning professionals can improve their delivery times through the use of Power BI. With the ability to track and monitor their shipments, they are able to quickly identify any issues and correct them. This has led to them being able to meet or exceed their delivery deadlines more often than not.
- Improved Customer Satisfaction
Power BI has helped many businesses improve customer satisfaction. The platform enables businesses to track customer satisfaction levels over time, and see how they compare to industry benchmarks. This information can help businesses identify areas where they need to make changes, in order to keep their customers happy.
- Customizable Dashboards
Power BI offers customizable dashboards that can be tailored to fit the specific needs of your organization. You can choose which tiles and widgets to include on your dashboard, and you can even create your own tiles with custom data visualizations. You can also customize the colors and fonts used in your dashboard, so it will match the look and feel of your organization’s website or other branding materials.
- Strong Visualizations
Power BI offers a wide variety of strong visualizations that can be used to display data in an easy-to-understand format. These visualizations can be used to answer specific questions about the data, or to help identify patterns and trends. Additionally, Power BI allows users to create their own custom visualizations, which can be tailored to their specific needs.
Integrate Resource Planning Data with Power BI
The data in Power BI can be used to help with resource planning.
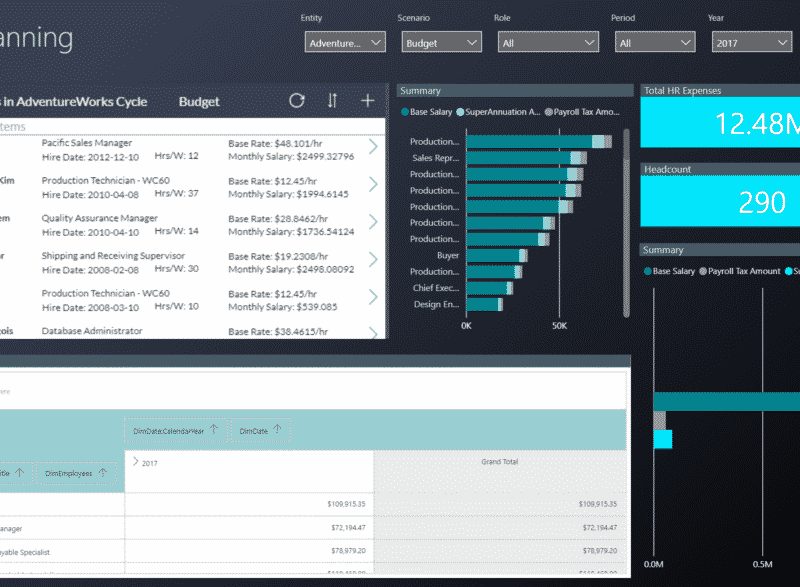
In order to help with resource planning, it is important to track the data related to usage and availability. In Power BI, this can be done by creating a new report that contains a table of information about resources and their usage. The table can include columns for the name of the resource, the start date and end date of the project, the number of hours used, and the cost. This report can then be used to help plan future projects and ensure that resources are available when needed.
Use Acterys for Resource Planning in Power BI
The Acterys Power Apps is an excellent tool for resource planning in Power BI. It helps to visualize and track resources using Power BI, making it easy to identify any potential bottlenecks. This can be especially helpful when planning resource allocation for large projects or when working with tight deadlines.


