Connect Salesforce to Power BI: Automated Data Loading
Power BI is a business analytics suite that delivers insights to enable fast decision making. It provides interactive visualizations with self-service BI tools. With Power BI, you can connect to hundreds of data sources, easily create beautiful reports, and quickly share your insights with others.
It is also a great tool for visualizing and forecasting Salesforce data. Salesforce users can easily import their datasets to Power BI and visualize them through pre-set templates. They can also create dashboards and see trends to make better business decisions.
But is Power BI the best platform for Salesforce data integration and forecasting? Let’s find out.
Why Connect Salesforce to Power BI?
One of the benefits of connecting Salesforce to Power BI is that you can create rich visualizations and reports of your data. This can help you to better understand your sales pipeline, forecast future sales, and track performance over time. Additionally, you can use Power BI to create dashboards and alerts to notify you when certain conditions are met (e.g. when a sale is made, when a lead is converted, etc.).
Why Visualize Salesforce Data in Power BI?
Visualizing Salesforce data in Power BI allows for greater insights and better decision-making. With the ability to easily create custom visuals and reports, as well as share them with others, teams can quickly gain a clear understanding of their sales data and performance. This can help inform strategies and tactics to improve sales productivity and results.
Reasons to Visualize Salesforce Data in Power BI
There are a few key reasons why you might want to visualize Salesforce data in Power BI.
- Perhaps the most obvious reason is that you can get a much better understanding of your data by looking at it in a visual format. With Power BI, you can create reports and dashboards that show your sales data in ways that are easy to understand.
- Another reason to use Power BI for Salesforce data is that it can help you to identify trends and patterns in your data. With powerful analytics tools at your disposal, you can gain insights into your sales process that you wouldn’t be able to see just by looking at the data in raw form.
- Finally, using Power BI for Salesforce data can help you to improve your sales process. By understanding your data better, you can make more informed decisions about how to improve your sales strategy and achieve better results.
How Power BI Helps Visualize Salesforce Data?
Power BI can help visualize Salesforce data in a variety of ways. For example, you can use charts to compare sales data from different time periods, or create maps to show where your customers are located. You can also use filters to isolate specific data sets, and drill down into the details to see how individual sales transactions were made.
Can Power BI Forecast Salesforce Data?
Power BI can be used to forecast Salesforce data by creating a model that uses historical data to predict future values. This can be done by importing the Salesforce data into Power BI and then creating a predictive model using the Time Series Forecasting function.
There is no simple answer to this question. While Power BI can certainly be used to forecast Salesforce data, the results will depend on a number of factors, including the quality of the data and the accuracy of the models used. In order to produce accurate forecasts, it is important to have a good understanding of both the data and the business process involved.
Apps to Integrate Salesforce with Power BI
If you are wondering how to integrate your Salesforce data with Power BI, then don’t worry. We have listed some of the best ways to integrate your Salesforce app with Power BI the easy way. All the apps in our list can help you connect Salesforce with Power BI with the click of a button.
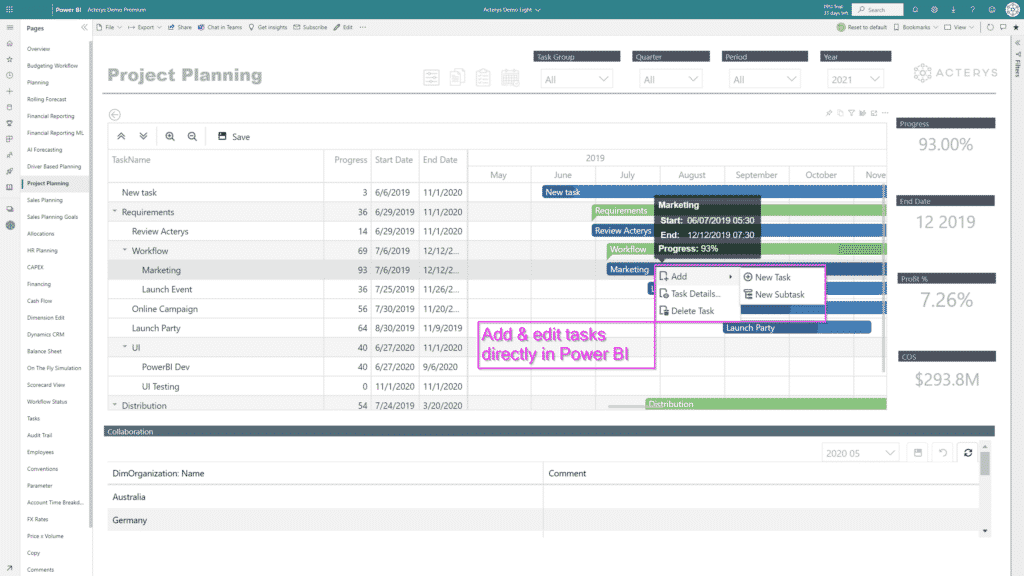
- Acterys
Acterys is one of the best ways to easily connect your Salesforce data with Power BI. Acterys, a Power BI App, works as a third-party integration tool that lets Salesforce users access Salesforce data in Power BI and to identify trends and patterns.
2. SalesforceIQ for Power BI
SalesforceIQ for Power BI is a great app to use for integrating Salesforce with Power BI. This app allows you to connect your Salesforce account with your Power BI account, so you can easily see your Salesforce data in your Power BI reports and dashboards.
3. Tableau
Tableau is another popular app for integrating Salesforce with Power BI. Tableau allows you to connect to your Salesforce data and create interactive dashboards and reports. You can also share your reports with others, so they can easily see your Salesforce data.
4. Microsoft Flow
Microsoft Flow is a handy tool for automating tasks between different apps and services. You can use Microsoft Flow to create workflows that automatically import your Salesforce data into Power BI each day. This can save you time and hassle, so you can focus on other tasks.
Why Use Acterys for Salesforce & Power BI Integration?
There are many reasons to use Acterys for Salesforce and Power BI integration. Perhaps the most compelling reason is that Acterys provides a single platform for data management, reporting, and analytics. This means that users can access all their data in one place, regardless of its source. Additionally, Acterys offers powerful features such as data visualizations and predictive analytics. These features make it easy for anyone to uncover insights and trends in your data. Finally, Acterys is easy to use, even for non-technical users. This makes it a great choice for organizations that want to get more value from their Salesforce data.
Ready to Extract Salesforce Insights with Power BI?
One of the advantages of extracting data insights from Salesforce is that users can easily predict trends and forecasts for better business decision making. One great tool to help extract Salesforce data insights is Acterys.
Acterys makes data visualizations in Power BI a breeze. With just a few clicks, you can create charts and graphs that help you understand your data in a much better way. You can learn more about Acterys Power BI apps here.